Why Choose an Implanting Machine for Efficient Production?

Time:2026-10-20 Author:Ethan
0%

Why choose an Implanting Machine for efficient production? The answer begins with repeatability, not impressive marketing. In a busy production line, operators may handle hundreds of components, seedlings, or workpieces each hour. Small placement errors can create rework, material loss, and uneven output. A properly configured Lmplanting Machine can control positioning, timing, depth, and movement with greater consistency.

The industry trend is clear. The International Federation of Robotics reported 541,302 industrial robots were installed worldwide in 2023. This figure shows continuing investment in automated production, even during market uncertainty. Deloitte’s 2024 Smart Manufacturing and Operations Survey found that 86% of manufacturers expect smart manufacturing to become a major competitiveness factor within three years. These reports do not prove that every factory needs an implanting system. They do show where production leadership is moving.

The details are practical. Sensors can check alignment before insertion. Programmable settings can support different product sizes. A stable feeding system can reduce pauses between cycles. Operators can then focus on inspection, maintenance, and process improvement. Not every line needs one.

A sound decision requires evidence. Measure cycle time, placement accuracy, downtime, labor hours, and rejected units before installation. Compare those figures after a controlled trial. The machine may reduce costs, but only when tooling, training, cleaning, and maintenance are included. That assumption needs testing. A reliable Implanting Machine is valuable when it fits the process, protects product quality, and delivers measurable improvement over time.
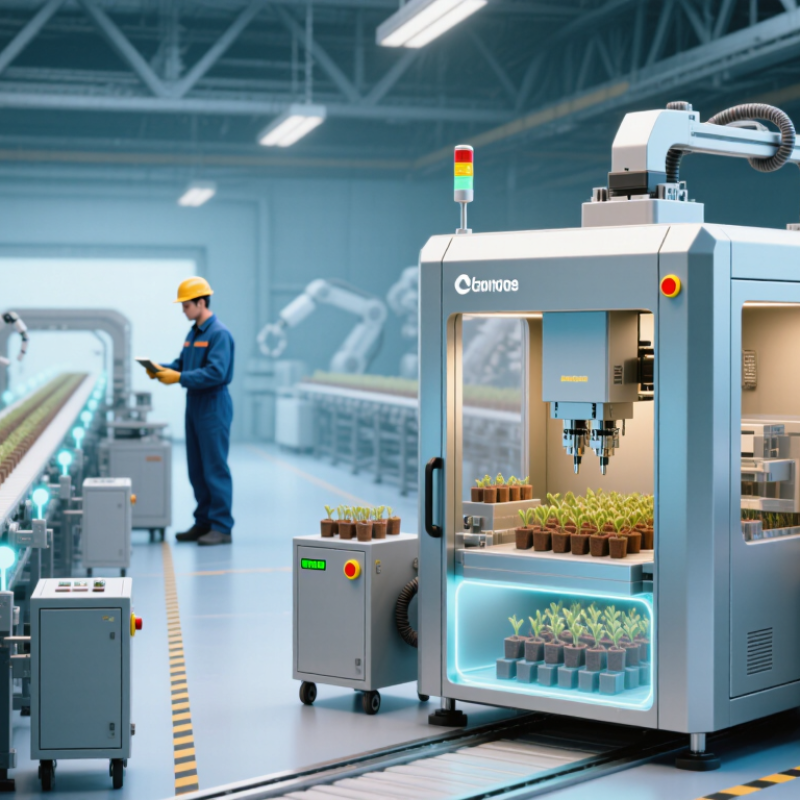
Why Choose an Implanting Machine for Efficient Production?

What Is an Implanting Machine? Core Functions, Types, and Process Flow

Why Choose an Implanting Machine for Efficient Production?

An implanting machine places small parts, inserts, pins, or components into a target material with controlled speed and force. Its core functions include feeding, orienting, positioning, implanting, and checking each piece. Sensors can confirm presence, depth, and alignment before the product moves forward. This reduces handwork and creates more consistent results on busy production lines.

Common types include pneumatic, servo-driven, rotary, and linear machines. Pneumatic models suit simple, repetitive tasks. Servo systems offer finer control over insertion depth and pressure. Rotary machines support high output, while linear machines provide flexible station layouts. A typical process begins with material loading. The feeder separates parts and sends them to the placement area. A fixture holds the product firmly. The actuator then inserts the part, and an inspection sensor checks the result. Faulty units can be diverted automatically.

Tips: Test the smallest and largest parts before full production. Keep feeders clean. Record insertion force, cycle time, and rejection rates. In practice, the first setting is rarely perfect. Operators may need to adjust vibration, tooling height, or air pressure. That learning stage matters. A machine can be fast but still waste material if alignment data is ignored. Regular calibration, clear work instructions, and sample inspections help maintain dependable performance over time.

Why Choose an Implanting Machine for Efficient Production?

Typical Ion Implantation Dose by Production Step

What is an implanting machine? An ion implanting machine introduces controlled amounts of dopant ions into a semiconductor wafer. Its core functions include wafer loading, beam generation, mass analysis, acceleration, dose control, scanning, and process monitoring.

Typical machine types: low-current systems are commonly used for shallow, low-dose adjustments; medium-current systems support general device fabrication; high-current systems are used when higher dopant concentrations and production throughput are required.

Process flow: wafer loading → surface cleaning → beam generation → ion separation → acceleration → wafer scanning and implantation → dose verification → annealing and inspection.

The chart shows representative dose levels commonly associated with major implantation steps. Actual settings vary according to device structure, dopant species, implant energy, wafer material, and production specifications.

How Does Automation Improve Throughput? Cycle Time and the 85% OEE Benchmark

An implanting machine can raise production output by reducing repeated manual handling. Its real value appears in cycle time, not impressive speed claims. A stable machine may place one component every 2.5 seconds, while operators prepare materials nearby. Shorter movement distances also reduce small delays between operations.

Automation improves throughput when each stage works at a predictable rhythm. Sensors can detect misalignment before a faulty part reaches the next station. Automatic feeding reduces pauses caused by uneven material supply. Changeover time still matters. A machine that runs quickly but needs 40 minutes for setup may lose much of its daily capacity. Track placement time, loading time, stoppages, and rework during every shift.

OEE offers a useful operational benchmark. It combines availability, performance, and quality. Reaching 85% OEE is often considered strong, but the number needs context. A line producing complex parts may face more inspection time than a simple line. Do not chase the percentage blindly. We once treated minor jams as harmless, yet their combined delay reduced actual output sharply. Review downtime records weekly, check rejected parts, and compare planned cycle time with real cycle time. The target should expose waste, not hide it.

Can It Improve Accuracy? Tolerance, Defect Rates, and ISO 9001 Controls

An implanting machine can turn repetitive placement into a controlled production process. Its value appears in small details: a calibrated guide, steady insertion force, and a vision check before release. These controls help operators hold specified tolerances across long production runs. A machine does not remove variation completely. Temperature, material hardness, tool wear, and alignment still affect results. In practice, measurements should be recorded at the start, middle, and end of each shift. That simple pattern often reveals drift before it becomes a costly defect.

Accuracy should be measured, not assumed. A quality team can compare actual positions with engineering limits and calculate defect rates by batch. It is measurable. If one shift shows repeated edge damage, the cause may be excessive force rather than operator error. The machine’s data should support this investigation, including time stamps, lot records, inspection results, and maintenance history. Clear records make corrective action more reliable. They also help separate a single mistake from a process trend.

ISO 9001 controls add discipline around the equipment. Documented procedures should cover setup, calibration, training, nonconforming output, and change approval. Audits can then verify whether instructions match the work floor. Still, paperwork can become a weakness. A checklist may be signed while a worn fixture remains unnoticed. That gap deserves attention. Regular gauge checks, practical operator feedback, and honest defect reporting create stronger control than forms alone. Process reviews should also question whether inspection points remain suitable after materials or tooling change.

What Is the ROI? Labor Hours, Payback Period, and Total Cost of Ownership

An implanting machine can turn repetitive placement work into a measured production process. The business case starts with labor hours, not impressive specifications. The International Federation of Robotics reported 541,302 industrial robots installed worldwide in 2023. That figure signals continued automation investment, but it does not guarantee a positive return.

Consider a line using three operators for two shifts. If automation removes 30 labor hours daily, an hourly labor cost of $24 creates $720 in potential daily savings. At 250 operating days, annual gross savings reach $180,000. A machine costing $135,000 could show a simple 9-month payback. This estimate excludes integration, training, maintenance, financing, and downtime. Reality is less tidy.

Total cost of ownership should include tooling, software support, spare parts, energy, quality checks, and scheduled servicing. The U.S. Bureau of Labor Statistics reported an average manufacturing labor productivity increase of 1.3% annually from 2013 to 2023. Automation can improve consistency, yet poor material feeding may erase those gains quickly. Deloitte’s 2024 Smart Manufacturing Survey found that manufacturers commonly pursue productivity, quality, and workforce benefits together. Measure all three. A practical review compares output per labor hour, defect rates, changeover time, and uptime for six to twelve months. Some calculations will be wrong at first. Revise them using production records, not supplier promises.

How Should Buyers Compare Machines? Capacity, Safety, and IEC 60204-1

Why Choose an Implanting Machine for Efficient Production?

Capacity should mean usable output, not the number shown on a brochure. Buyers should compare cycles per hour, loading time, changeovers, and reject rates. A machine producing 1,000 units hourly may deliver less after cleaning, inspection, and stoppages. The International Federation of Robotics reported 541,302 industrial robot installations in 2023, with 4.28 million robots operating worldwide. This growth shows automation’s value, but it does not make every high-speed machine suitable. Plant trials often reveal the missing details: awkward access, slow product alignment, or frequent operator adjustments.

Safety requires more than an emergency-stop button. IEC 60204-1 addresses electrical equipment for machinery, including protective bonding, control circuits, isolation, documentation, and emergency functions. Buyers should request wiring diagrams, test records, fault-response demonstrations, and maintenance instructions. They should also confirm the applicable edition and local requirements. A supplier’s “compliant” statement is not enough without evidence. That sounds strict, yet small gaps can create expensive downtime. Safety reviews should include operators and maintenance staff, not only engineers.

Tips: Measure real output during a full shift. Record jams, changeover minutes, rejected units, and cleaning time. Check whether guards remain practical during routine maintenance. Ask for training materials and spare-part lead times. Do not choose capacity alone. A slower machine with stable feeding may outperform a faster model. My own caution is simple: published figures are useful, but production-floor behavior is the harder truth.

Why Choose an Implanting Machine for Efficient Production? - How Should Buyers Compare Machines? Capacity, Safety, and IEC 60204-1
Comparison Dimension Compact Implanting Machine Standard Production Implanting Machine High-Capacity Automated Implanting Machine
Typical Production Capacity Approximately 800–1,500 pieces per hour, depending on product size, material, and operator handling. Approximately 3,000–6,000 pieces per hour when automatic feeding, positioning, and unloading are available.
Typical Cycle Time About 2.4–4.5 seconds per cycle. About 1.2–2.4 seconds per cycle. About 0.6–1.2 seconds per cycle, excluding material replenishment and stoppages.
Recommended Workload Small batches, product trials, seasonal production, and facilities with limited floor space. Long production runs with consistent product specifications and high utilization targets.
Capacity Evaluation Method Compare machines using the same material, product dimensions, tooling, operator method, and quality target. Rated speed alone is not enough; practical output should account for setup, feeding, inspection, replenishment, and minor stoppages.
Electrical Supply Commonly available in single-phase 220–240 V systems; confirm frequency and current requirements before purchase. Commonly available in 220–240 V or 380–400 V systems, depending on motor and control-panel design. Often requires three-phase 380–400 V power and a dedicated electrical installation.
Installed Power Typically about 1–3 kW. Typically about 3–7.5 kW. Typically about 7.5–20 kW, especially when conveyors, feeders, or pneumatic systems are integrated.
Machine Footprint Typically about 1.0–2.0 m², excluding material storage. Typically about 2.0–4.0 m², excluding operator access space. Typically about 4.0–10.0 m², including automated feeding and discharge sections.
Guarding and Access Control Fixed guards and accessible emergency-stop devices should protect the operating area. Full perimeter guarding, interlocked doors, safety switches, and controlled restart procedures are normally required.
Emergency Stop Function At least one clearly marked, manually reset emergency-stop device should be located near the operator position. Emergency-stop devices should be positioned at the operator station and other accessible risk points. Multiple emergency-stop devices should be installed along the production line, with reset and restart logic preventing automatic restart.
IEC 60204-1 Evaluation Request electrical drawings, protective-circuit details, component ratings, and test records demonstrating alignment with IEC 60204-1. Require a complete electrical safety file, risk-assessment linkage, safety-circuit validation, inspection records, and evidence that the integrated line was assessed as a complete system.
Important IEC 60204-1 Checks Verify protective bonding, disconnecting means, overcurrent protection, control-circuit protection, emergency-stop performance, electrical documentation, conductor identification, enclosure protection, and testing after assembly. IEC 60204-1 addresses the electrical equipment of machines; it does not replace the machine risk assessment or applicable local regulations.
Changeover Time Usually about 10–30 minutes for simple tooling or parameter changes. Usually about 15–45 minutes, depending on tooling access and recipe management. Usually about 30–90 minutes when feeders, fixtures, sensors, and software parameters must be adjusted.
Automation Level Manual loading with assisted positioning or semi-automatic operation. Automatic operating cycle with manual loading, guided setup, and programmable parameters. Automatic loading, positioning, processing, inspection options, data collection, and discharge integration.
Labor Requirement Usually one operator per machine, with more frequent manual handling. Usually one operator can supervise one machine or a small machine group. One operator may supervise several units, but maintenance and line-control skills are required.
Maintenance Considerations Simple access to wear parts and low complexity; suitable for facilities with basic maintenance capability. Higher maintenance demands for drives, sensors, pneumatic components, controllers, and automated feeding systems.
Best Buying Priority Low initial investment, compact layout, flexible setup, and ease of operation. Maximum output, integration capability, automated quality control, and strong technical support.
Main Purchasing Risk A low purchase price may conceal lower output, more manual labor, and limited expansion capability. Actual output may fall below the rated capacity if feeding, tooling, or material variation is not controlled. High capital cost and complex commissioning may reduce return on investment when production volume is inconsistent.
Recommended Acceptance Test Conduct a sample-production test using the buyer’s actual materials and products. Record cycle time, good-piece rate, reject rate, changeover duration, emergency-stop response, restart behavior, noise, power consumption, and operator workload before final acceptance.
Overall Selection Guidance Choose when flexibility and low-volume production are more important than maximum throughput. Choose only when demand is high and stable enough to justify automation, integration, training, and maintenance costs.
Purchasing note: The capacity figures are typical engineering ranges rather than guaranteed outputs. Actual performance depends on product geometry, material properties, tooling, feeding method, operator skill, quality requirements, and factory conditions. Buyers should obtain a documented performance test and verify IEC 60204-1-related electrical safety evidence for the complete machine configuration before purchase.

FAQS

How can an automated placement machine improve throughput?

It reduces repeated handling and keeps each operation at a predictable rhythm. A stable machine may place one component every 2.5 seconds. Shorter movements reduce small delays. Small delays matter.

What should manufacturers measure when evaluating throughput?

Track placement time, loading time, stoppages, changeovers, and rework. Record these figures during every shift. A fast machine may lose capacity during a 40-minute setup.

Is 85% OEE always the right production target?

Not always. OEE combines availability, performance, and quality. An 85% result can be strong, but product complexity changes the meaning. Use the figure to expose waste, not hide it. The target may need revision.

How can automation improve placement accuracy?

Calibrated guides, steady insertion force, and vision checks reduce variation. Measurements should be taken at the start, middle, and end of each shift. This pattern can reveal drift before defects increase.

What factors can still reduce accuracy?

Temperature, material hardness, tool wear, and alignment can affect results. Automation does not remove variation completely. A worn fixture may cause edge damage during placement. Machines are not perfect.

What records support quality investigations?

Keep time stamps, lot information, inspection results, and maintenance history. Compare actual positions with engineering limits. Calculate defect rates by batch and shift. Our first estimate was too optimistic.

How should a company calculate automation payback?

Start with saved labor hours and realistic hourly costs. For example, removing 30 daily labor hours at $24 saves $720 daily. At 250 operating days, gross annual savings could reach $180,000. This is only a simple estimate.

What costs belong in the total ownership calculation?

Include integration, training, tooling, software support, spare parts, energy, inspections, and servicing. Also include financing and downtime. Review output per labor hour, defects, changeover time, and uptime for six to twelve months. Reality is less tidy.

Conclusion

An Lmplanting Machine is an automated production system designed to place, insert, or implant components with consistent speed and precision. This article explains its core functions, common machine types, and typical process flow, from material feeding and positioning to implantation, inspection, and output. Automation can improve throughput by reducing manual handling and stabilizing cycle times, while an OEE target of around 85% provides a useful benchmark for evaluating equipment performance.

The discussion also considers accuracy through tolerance control, defect-rate monitoring, and ISO 9001-based quality procedures. Buyers can estimate return on investment by comparing labor-hour savings, expected payback periods, maintenance needs, energy use, and total cost of ownership. When comparing machines, companies should review capacity, flexibility, safety features, operator access, and compliance with IEC 60204-1. A well-selected system can support reliable production, improve workplace consistency, and deliver measurable long-term value.


Ethan

Ethan

Ethan is a seasoned marketing professional with a deep expertise in our company's innovative product line. With a passion for sharing knowledge and insights, he takes the lead in regularly updating our corporate blog, where he explores industry trends, product features, and effective marketing......